Quick Start Guide on VS for WinForms
This guide is based on Visual Studio 2022. The project created in this guide is developed in .NET 8.
Display a Simple Map using WinForms
In this section, we'll show you how to create a visually appealing map with external data and styling. We highly recommend that you also take a look at the How Do I Sample, which contains numerous examples that cover virtually everything you can do with the control.
First, to begin working on the map, you'll need to create a .NET WinForms project using Visual Studio 2022. Once that's done, we'll guide you through adding the required packages and setting up the map with a background on the default form. Next, we'll show you how to add a shapefile to the map and customize it with styles.
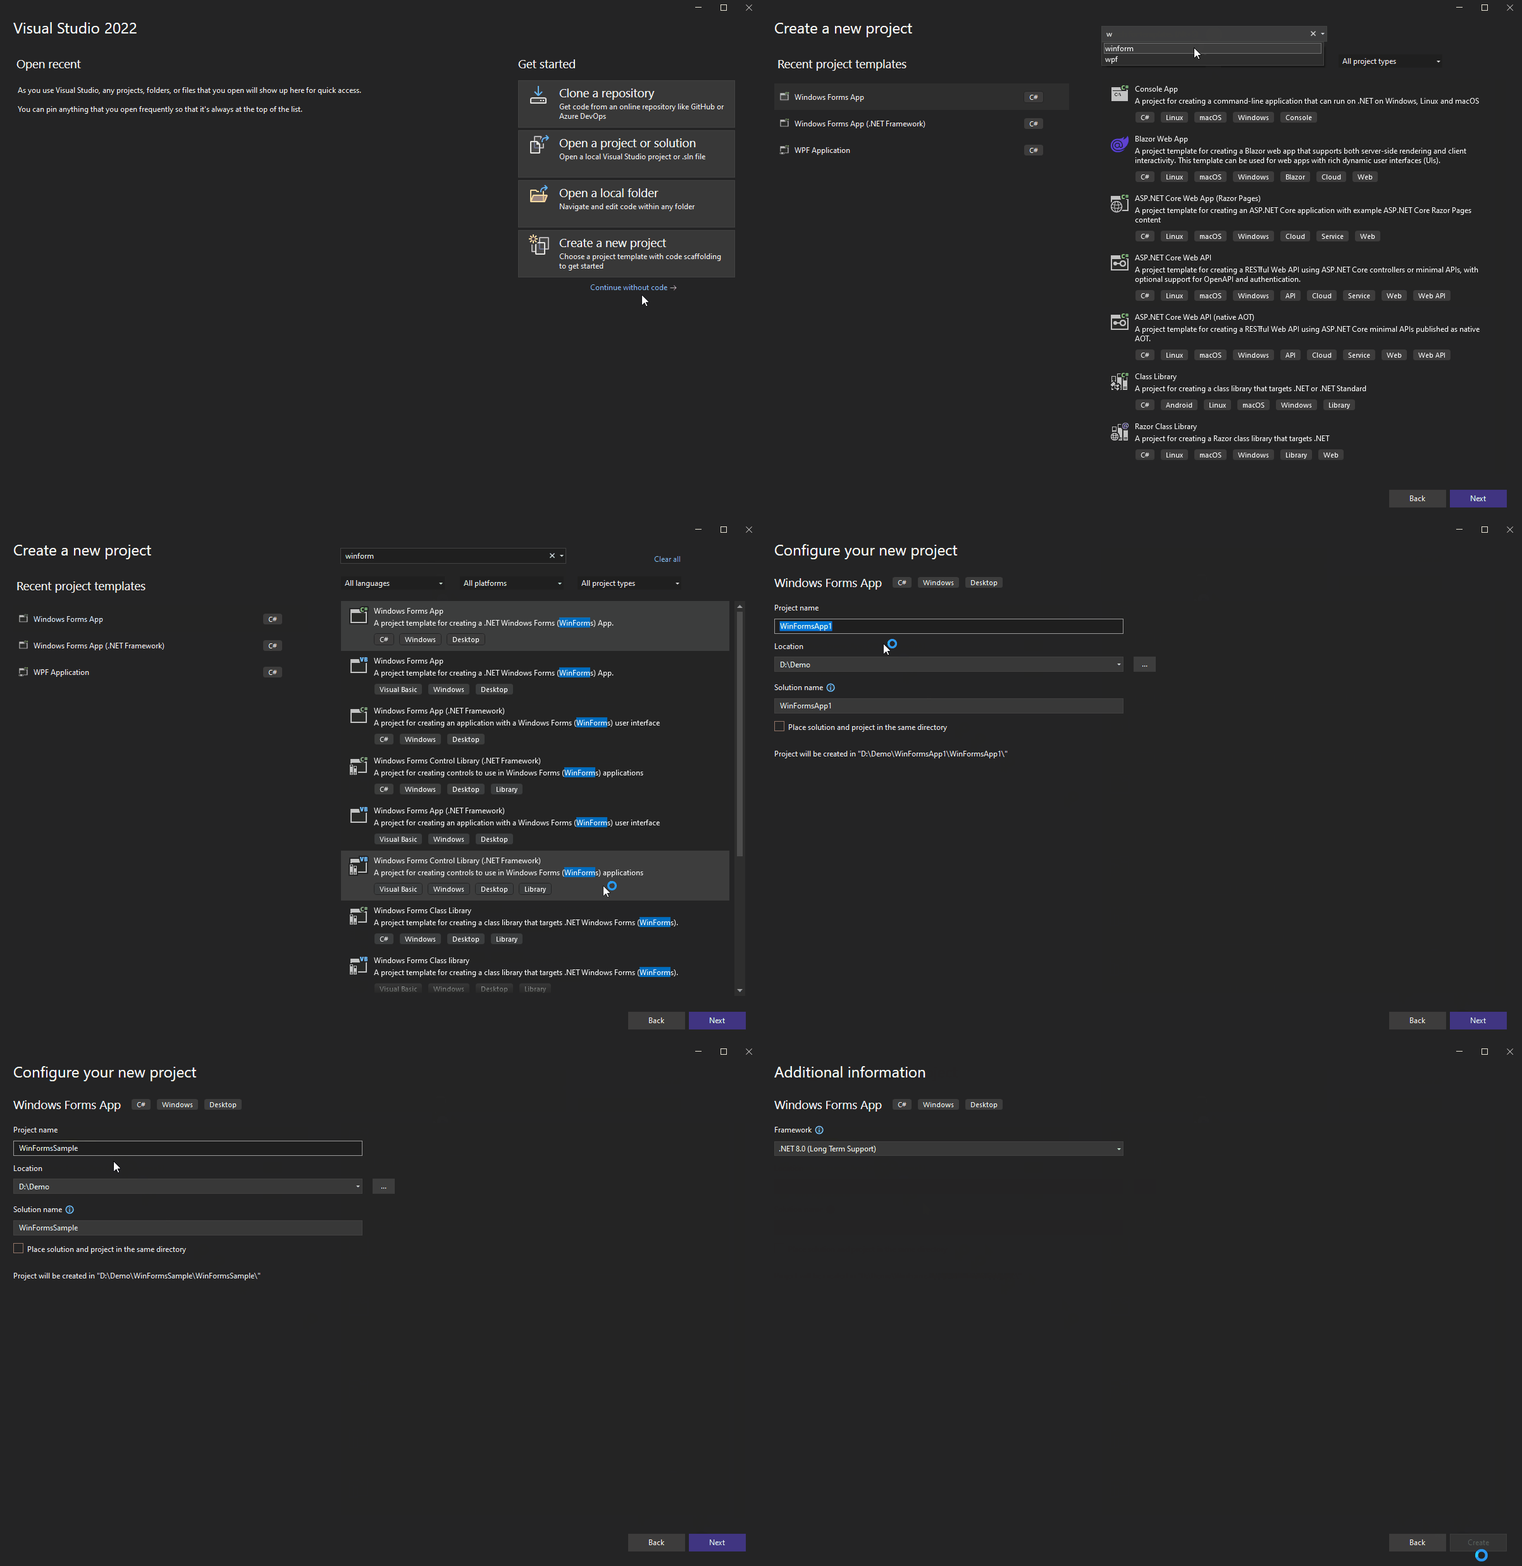
Step 1: Create a WinForms Project
Create a C# WinForms project with .NET 8.0.
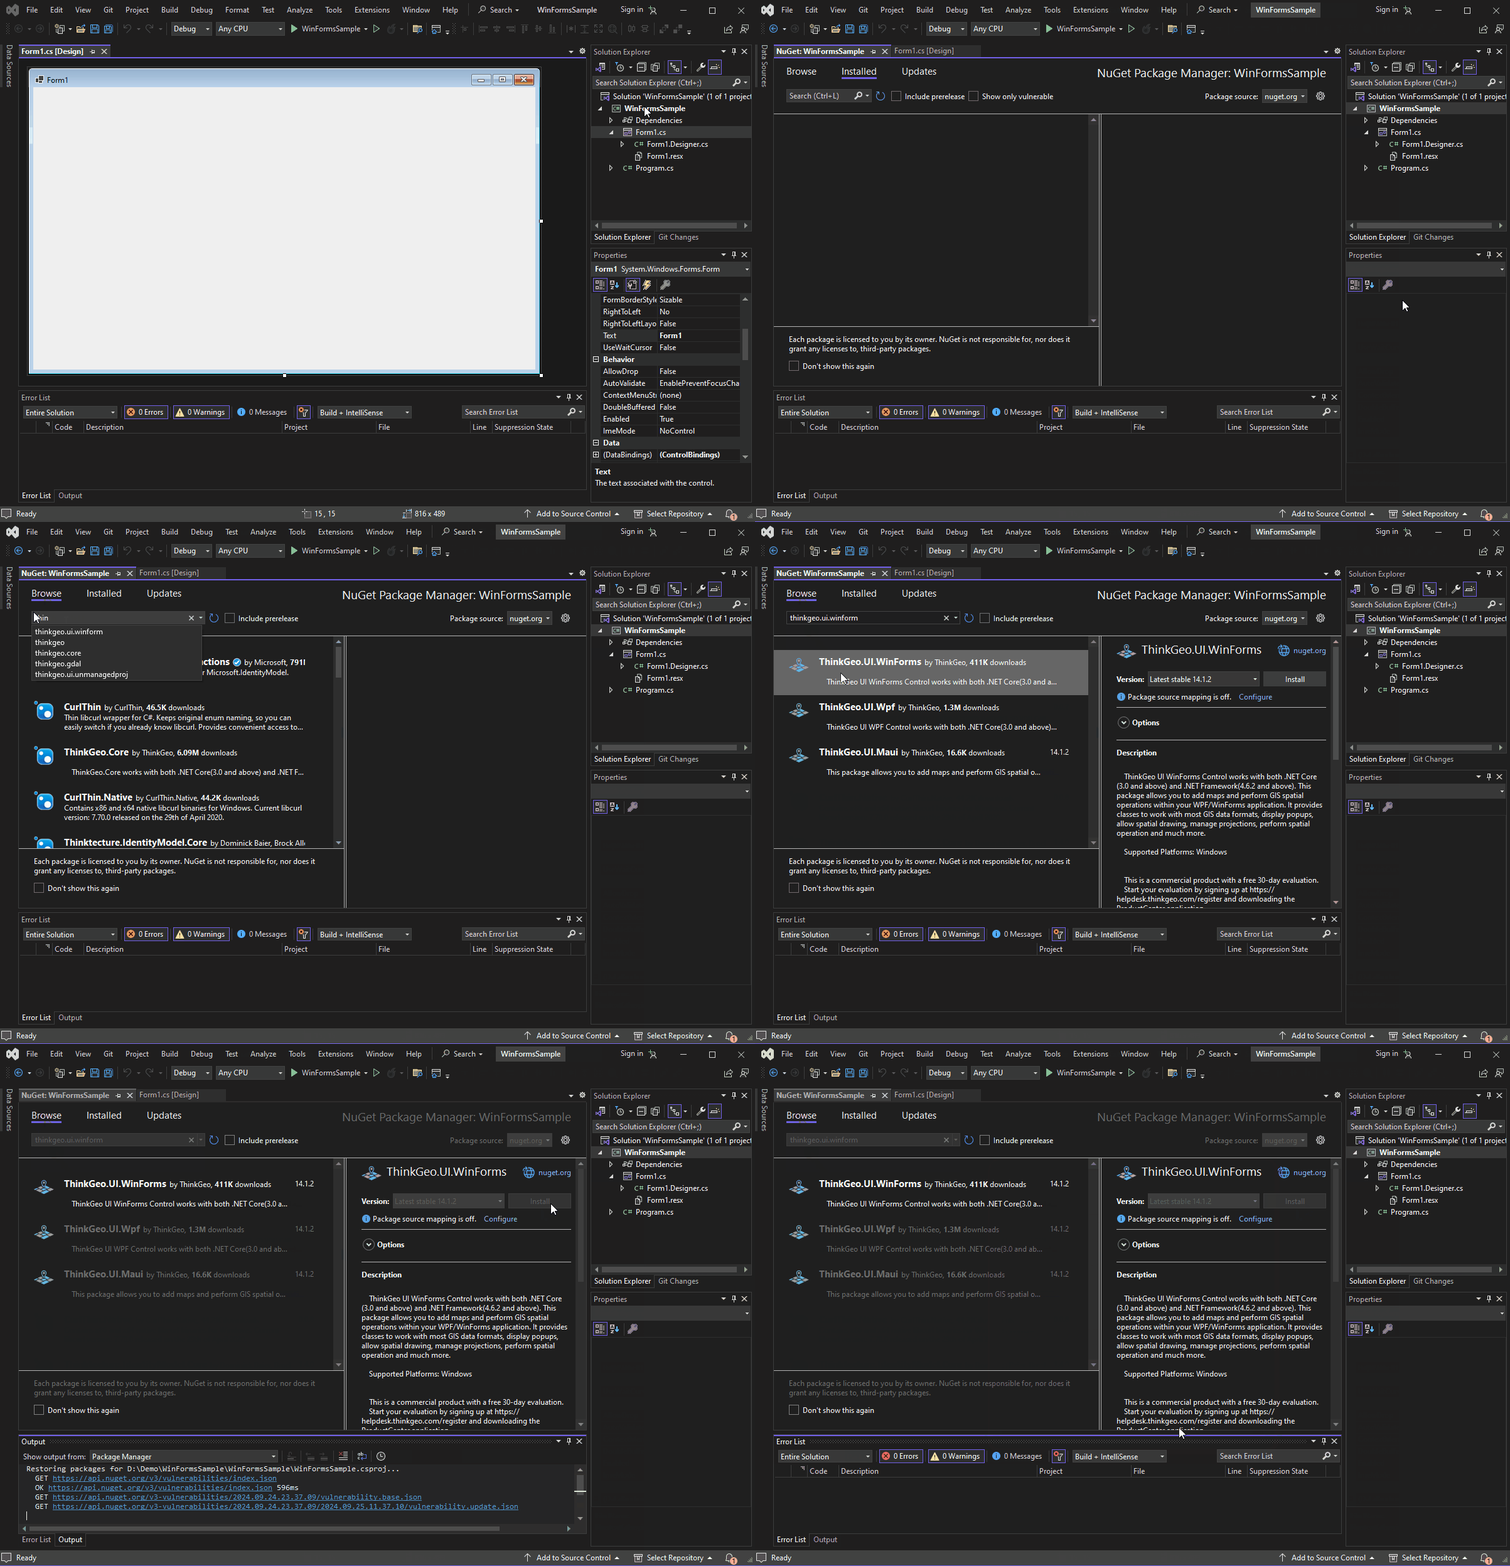
Step 2: Add Nuget Packages:
Install ThinkGeo.UI.WinForms NuGet package through NuGet package manager.
You can switch between the Beta Branch and Release Branch by checking/unchecking the "Include prerelease" checkbox. The Beta Branch contains the latest features/bug fixes, while the Release Branch is more stable and better tested.
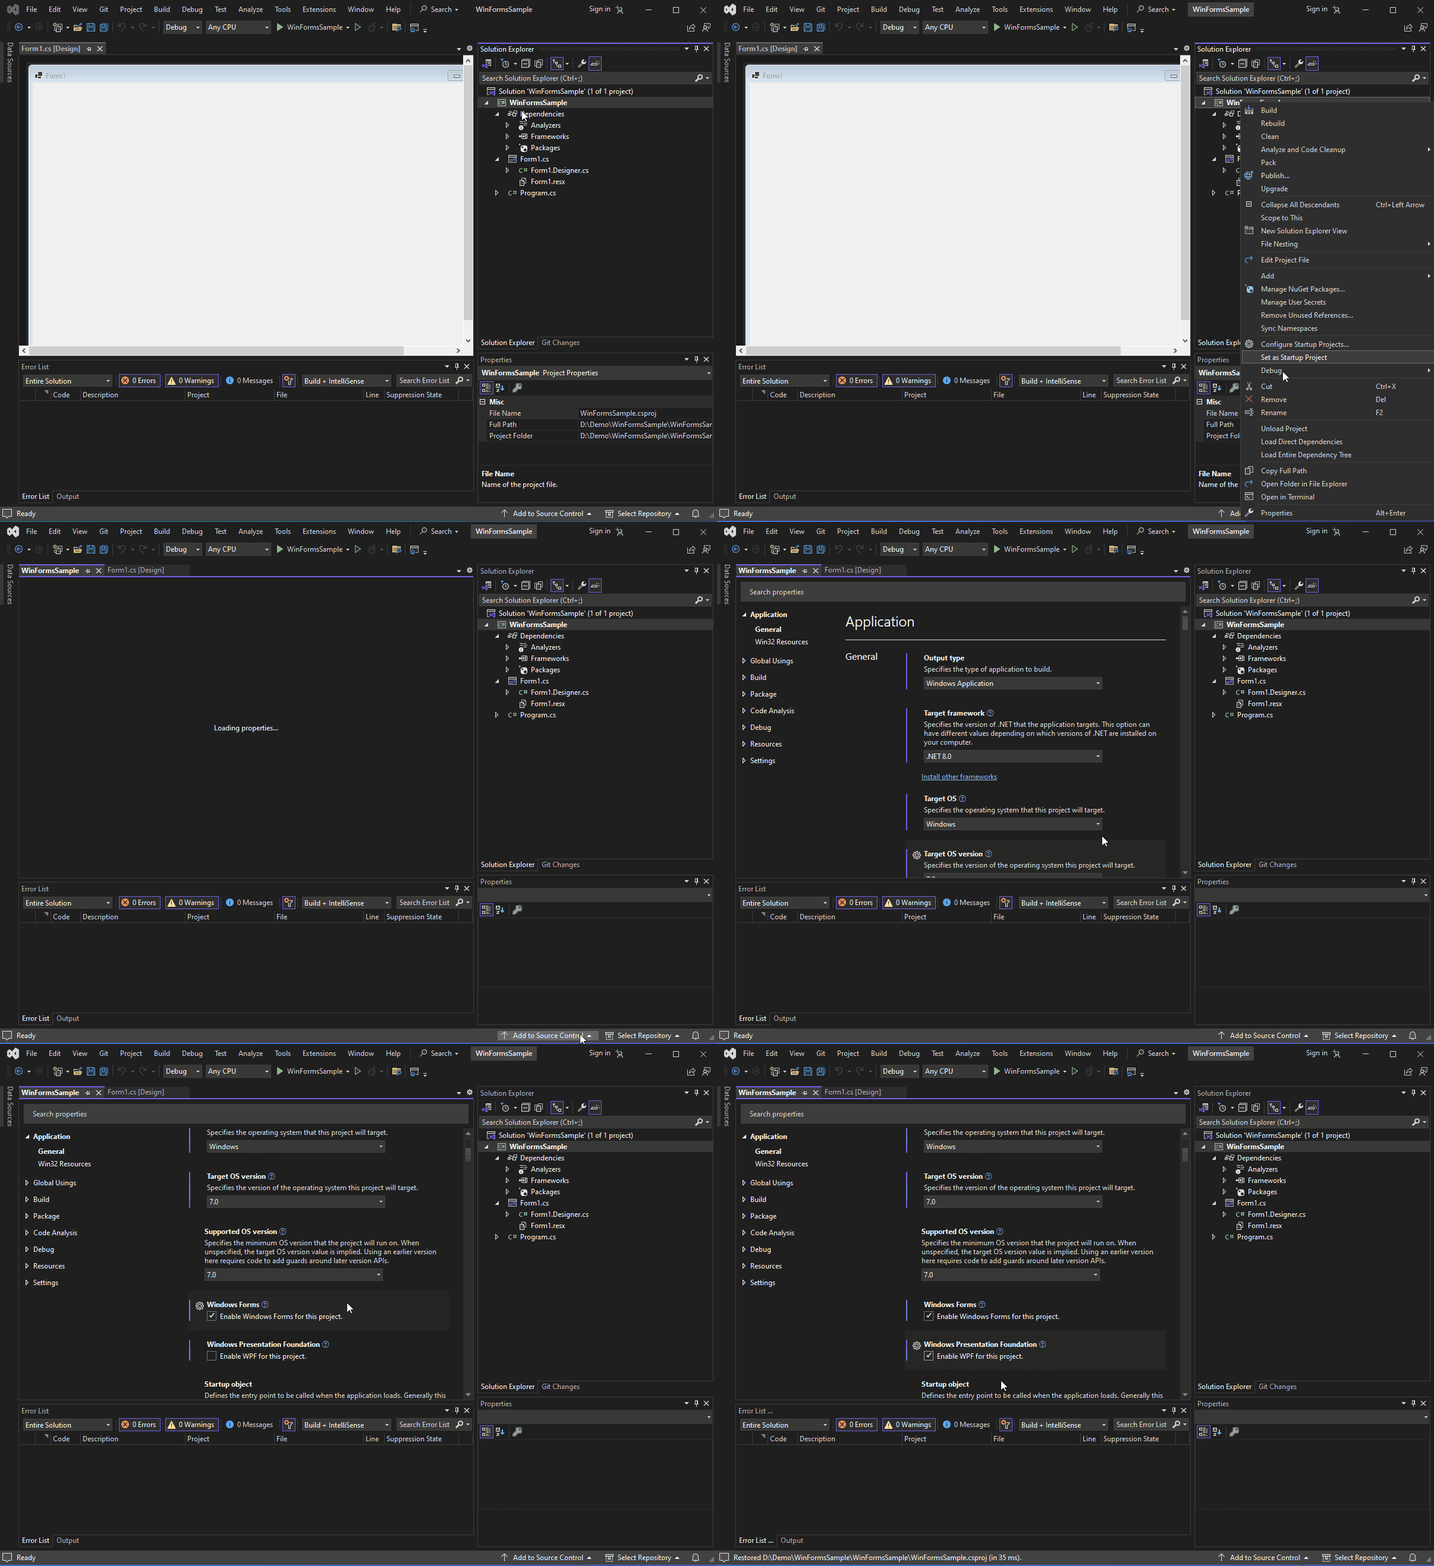
Step 3: Enable WPF Support for the Project
When using ThinkGeo.UI.WinForms in a WinForms project, you may need to enable support for WPF assemblies, specifically WindowsBase and WindowsFormsIntegration, due to the following reasons:
-
ThinkGeo Controls and WPF Integration: ThinkGeo’s WinForms controls often rely on Windows Presentation Foundation (WPF) functionality when running on .NET. The required
WindowsBase.dllfile, part of the .NET runtime, supports WPF elements within the application. -
Hosting WPF Content in WinForms:
WindowsFormsIntegration.dllis essential for integrating Windows Forms and WPF content, allowing you to host WPF elements within a Windows Forms application if needed. Referencing this library enables smooth interaction between WPF and WinForms controls.
To enable these dependencies:
-
Open Project Properties: In Visual Studio, right-click your project and select
Properties. -
Enable WPF Support:
2.1. Go to theApplicationtab and then to theGeneralsection.
2.2. Check the box labeledEnable WPF for this project.
Enabling this option automatically includes the necessary WPF assemblies, such as WindowsBase and WindowsFormsIntegration, you no longer need to manually locate and add these DLLs, as Visual Studio will handle the references for you.
Step 4: Add the Map Control to Form1.cs
Add the ThinkGeo.Core and ThinkGeo.UI.WinForms namespaces to the Form1.cs file using a using directive.
using ThinkGeo.Core;
using ThinkGeo.UI.WinForms;
Add the map control to the Form1 class in the Form1.cs and initialize it in the constructor.
 public partial class Form1 : Form
 {
     private MapView mapView;
     public Form1()
     {
         InitializeComponent();
         mapView = new ThinkGeo.UI.WinForms.MapView();
         mapView.Size = new System.Drawing.Size(800, 450);
         mapView.Dock = DockStyle.Fill;
         Controls.Add(this.mapView);
     }
 }
Step 5: Add the ThinkGeo Background Map
Add the form's load event in the Form1 constructor to display the map.
this.Load += new System.EventHandler(this.Form_Load);
Add the following code to the Form_Load event, which is triggered when Form1 is fully loaded and ready to use. (The key passed to ThinkGeoCloudVectorMapsOverlay is for test only; you can apply for your own key from ThinkGeo Cloud)
We have set up a tile cache for the base overlay to improve performance. This cache retrieves tiles from the local disk instead of downloading them from the internet each time they are needed.
private async void Form_Load(object? sender, EventArgs e)
{
    // Set the map's unit of measurement to meters(Spherical Mercator)
    mapView.MapUnit = GeographyUnit.Meter;

    // Add Cloud Maps as a background overlay
    var thinkGeoCloudVectorMapsOverlay = new ThinkGeoCloudVectorMapsOverlay
    {
        ClientId = "AOf22-EmFgIEeK4qkdx5HhwbkBjiRCmIDbIYuP8jWbc~",
        ClientSecret = "xK0pbuywjaZx4sqauaga8DMlzZprz0qQSjLTow90EhBx5D8gFd2krw~~",
        MapType = ThinkGeoCloudVectorMapsMapType.Light,
        TileCache = new FileRasterTileCache(@".\cache", "thinkgeo_vector_light")
    };
    mapView.Overlays.Add(thinkGeoCloudVectorMapsOverlay);

    // Set the map extent
    mapView.CurrentExtent = MaxExtents.ThinkGeoMaps;

    await mapView.RefreshAsync();
}
Step 6: Run the Sample & Register for Your Free Evaluation
The first time you run your application, if you have not installed a license, you may encounter a 'licenses not installed' exception.
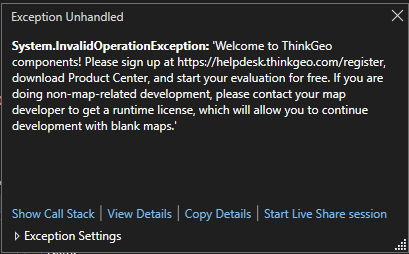
You can open ThinkGeo's Registration Website to create an account and start a 30-day free evaluation. From there, you can download and install the Product Center to manage licenses for ThinkGeo products.

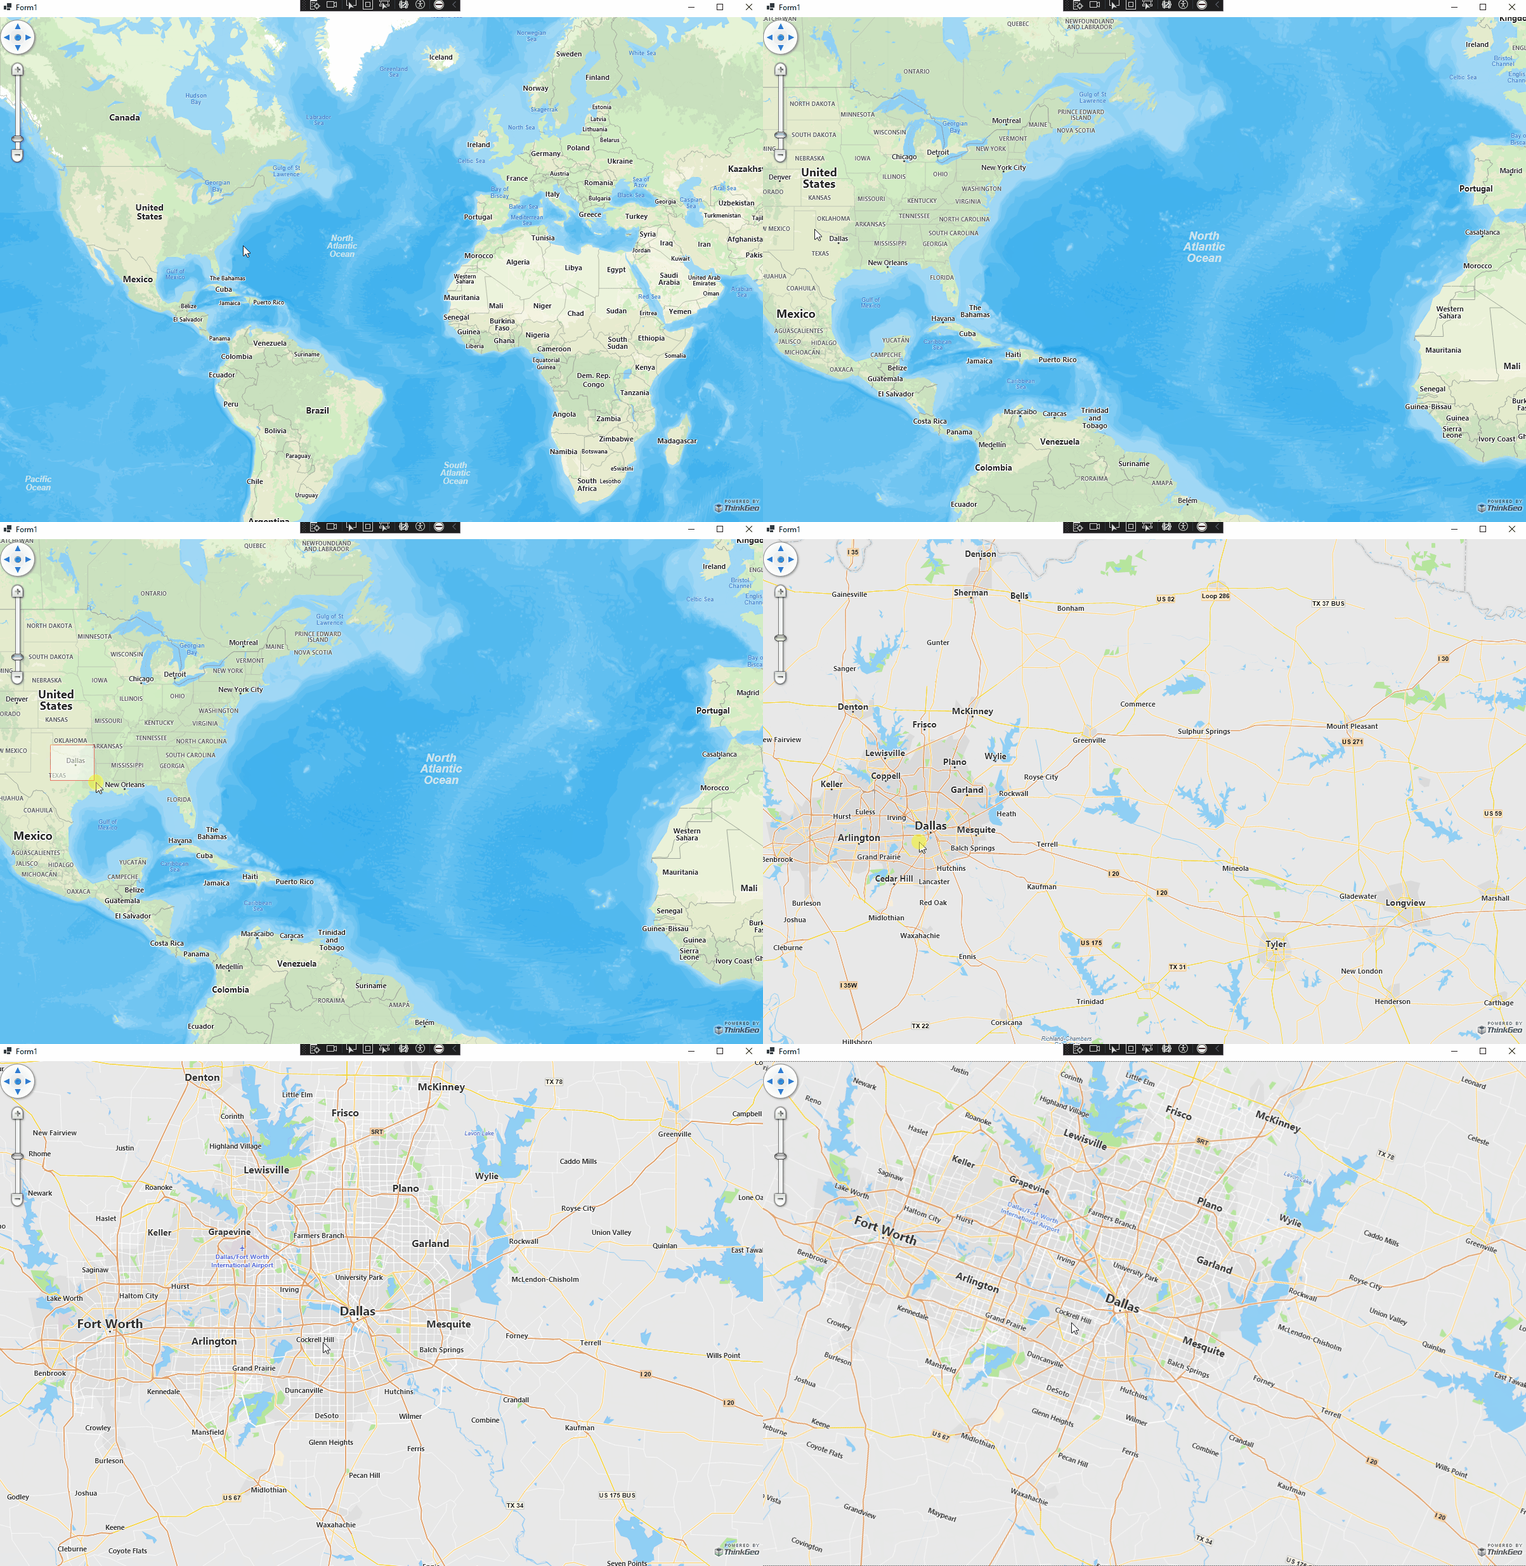
Once you activate the 'ThinkGeo UI WinForms' license to start your evaluation, you should be able to see the map with our Cloud Maps layer! You can double-click to zoom in, use the mouse wheel to zoom in/out, and track zoom in by holding down the Shift key and tracking the map. Additionally, you can rotate the map by holding down the Alt key and dragging the map.
Step 7: Add a Point Data Layer to the map
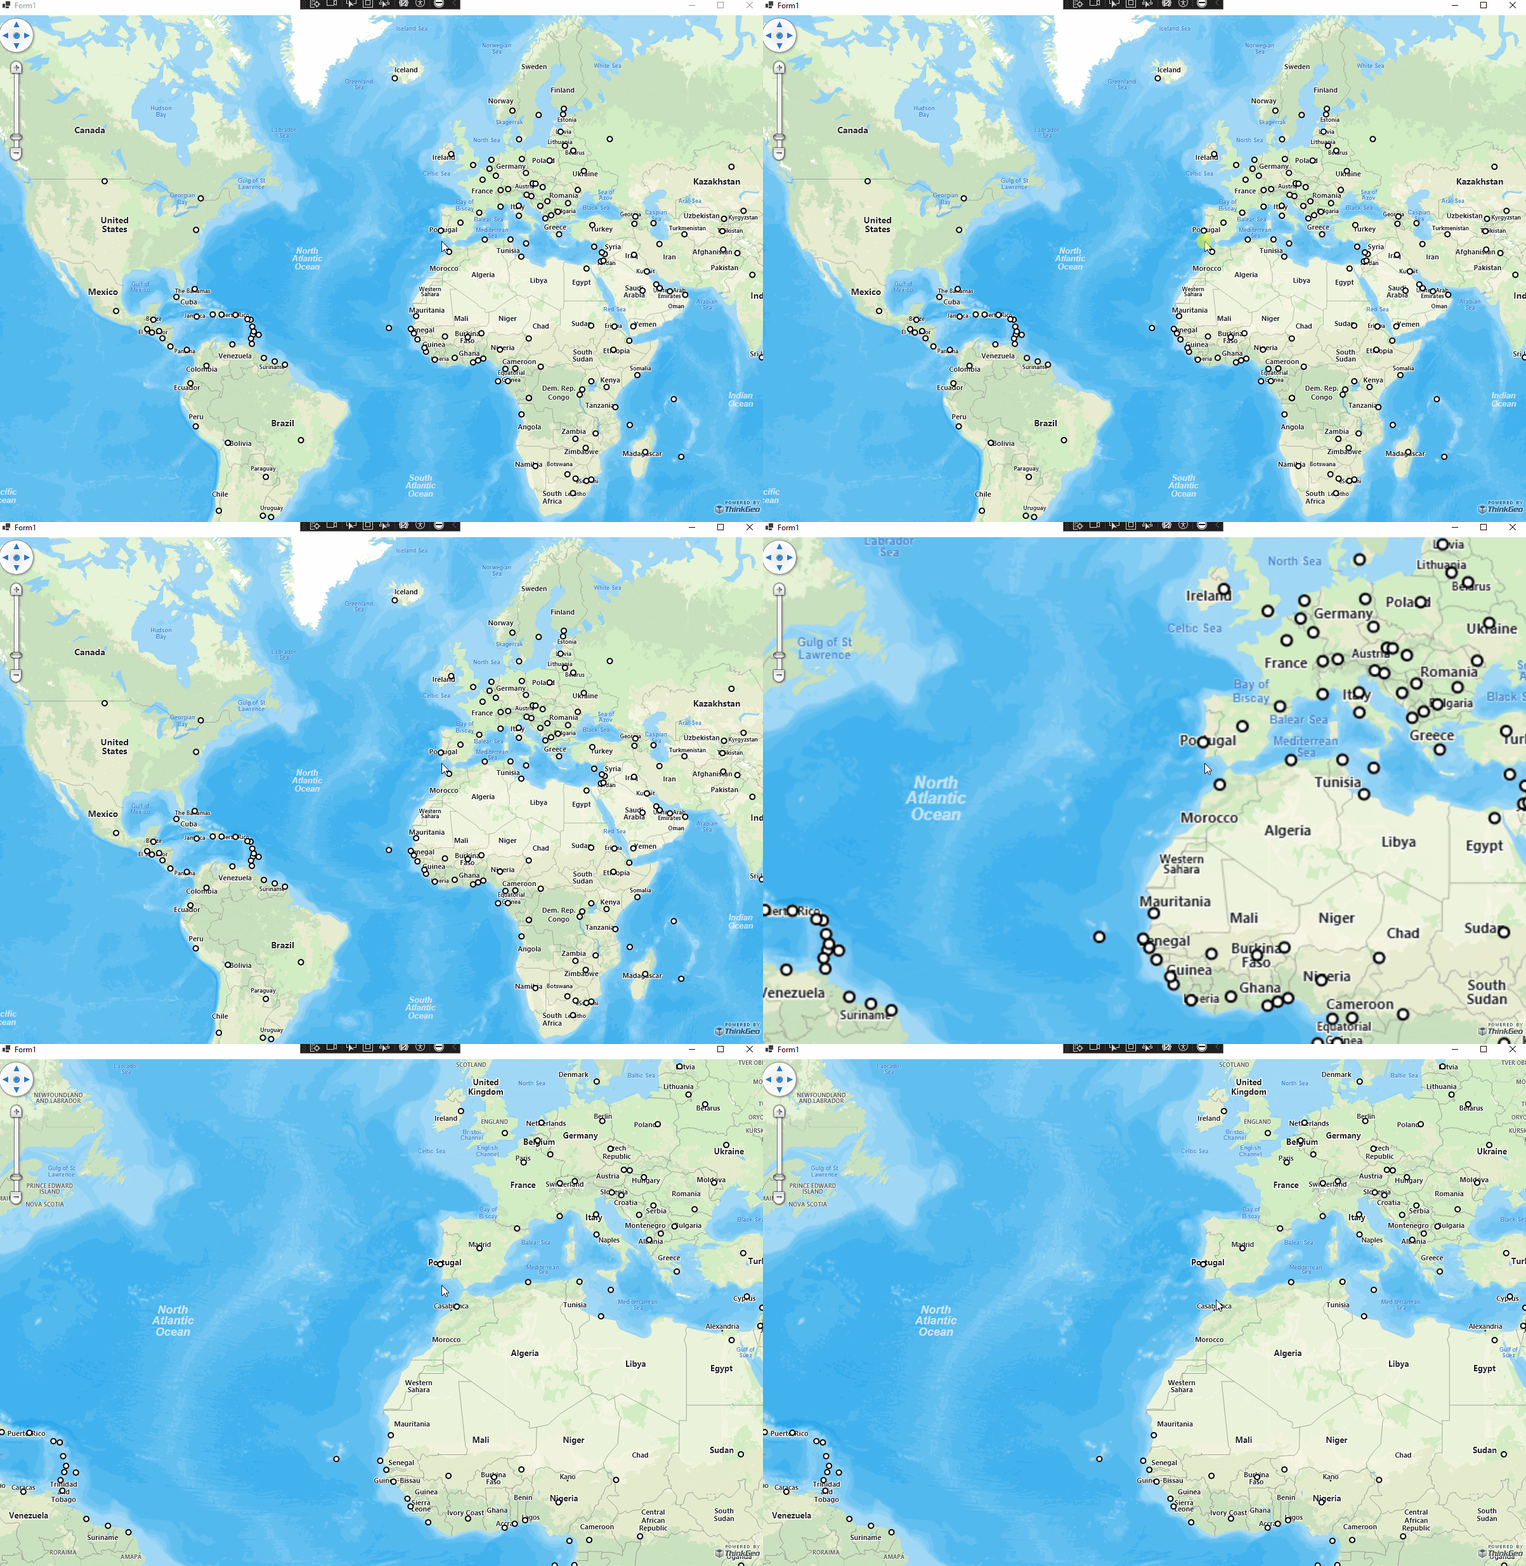
Now that you have a basic setup, you can add custom data to the map. Depending on the data, this process can be complex or quite simple. Here, we will add a shapefile to the map, set its style, apply the style across a range of zoom levels, and project the shapefile from one projection (Decimal Degrees) to another (Spherical Mercator). This is essentially what you might need to do when displaying feature data on the map.
Download the WorldCapitals shapefile data and use it in your project under a new folder called AppData. From there, we can add the shapefile to the map.
// Add a shapefile layer with point style.
var capitalLayer = new ShapeFileFeatureLayer(@"..\..\..\AppData\WorldCapitals.shp");
var capitalStyle = new PointStyle()
{
    SymbolType = PointSymbolType.Circle,
    SymbolSize = 8,
    FillBrush = new GeoSolidBrush(GeoColors.White),
    OutlinePen = new GeoPen(GeoColors.Black, 2)
};
// Each layer has 20 preset zoomlevels. Here we set the capitalStyle for ZoomLevel01 and apply the style to the other preset zoomlevels.
capitalLayer.ZoomLevelSet.ZoomLevel01.DefaultPointStyle = capitalStyle;
capitalLayer.ZoomLevelSet.ZoomLevel01.ApplyUntilZoomLevel = ApplyUntilZoomLevel.Level20;

// The shapefile is in Decimal Degrees, while the base overlay is in Spherical Mercator.
// It's why the shapefile needs to be reprojected to match the coordinate system of the base overlay.
capitalLayer.FeatureSource.ProjectionConverter =
    new ProjectionConverter(Projection.GetDecimalDegreesProjString(), Projection.GetSphericalMercatorProjString());

// Add the layer to an overlay, add that overlay to the map.
var customDataOverlay = new LayerOverlay();
customDataOverlay.Layers.Add(capitalLayer);
mapView.Overlays.Add(customDataOverlay);
Summary
You now have a basic understanding of how to use the ThinkGeo Map controls and can begin adding functionality to your own applications. Let's review what we've learned about the object relationships and how the pieces of ThinkGeo UI work together:
- A
MapViewis the fundamental control that contains all the other objects used to determine how the map is rendered. - A
MapViewhas multipleOverlays, and eachOverlaycorresponds to a tier of images displayed on the map control. - A
LayerOverlayhas multiple layers, and eachLayercorresponds to a single data source. This can be a vector-basedFeatureLayer(such as a shapefile or SQLite) or a raster-basedRasterLayer(such as TIFF or MrSID). - A
FeatureLayercan have multipleZoomLevels, which define the upper and lower ranges of when a layer should be shown or hidden, and the styles for how the layer is supposed to be displayed. - The
MapUnit(feet, meters, decimal degrees, etc.) andCurrentExtentneed to be correctly set for theMapcontrol.
Congratulations, you are now in an excellent position to review the How Do I Sample and explore other features.